Faking Climate Change Data & Visualizing for the Color Blind, in Sci-Fi Movies & in W.E.B. Du Bois’ Black America
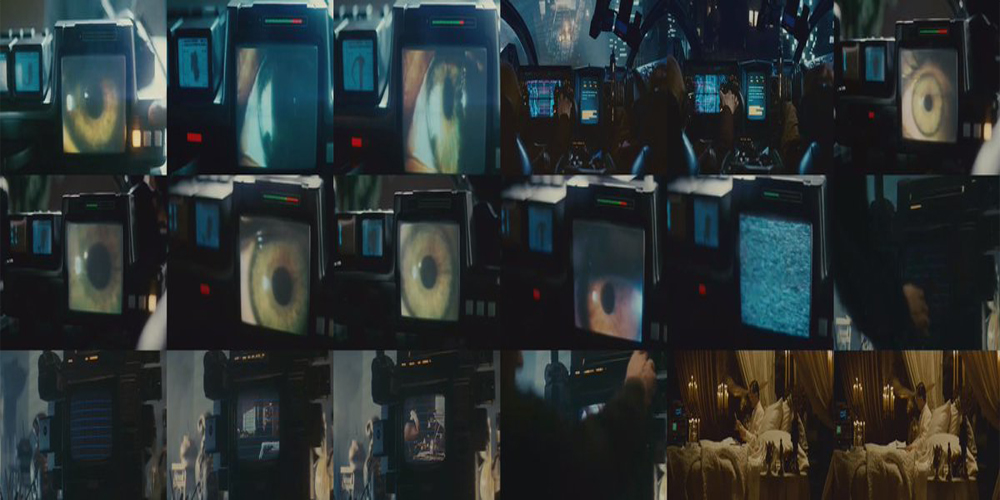
What’s the global data journalism community tweeting about this week? Our NodeXL #ddj mapping from Aug 6 to 12 finds @sciam profiling a new color scale for the color blind, @EDudinskij‘s fun dissertation on dataviz in science fiction movies, @morgenpostusing satellite imagery to show the consequences of droughts, and @gregladen and Grant Foster calling bull on a climate change denier’s flawed graphs.
The Problem with Rainbow Color Scales
Data visualizations using rainbow color scales can sometimes be misleading and, for those with color blindness, are completely unintelligible. Now scientists at a US Department of Energy lab have developed a color scale — Cividis — that is mathematically optimized to be accurate for both color blind people and those with normal vision.
Credit by- Gijn
If you like the story and if you wish more such stories, support our effort Make a donation.
Trending News

Sat May 30 2026 | By Newsdesk
Sat May 30 2026 | By Newsdesk
Sat May 30 2026 | By Newsdesk

Sat May 30 2026 | By Newsdesk
Sat May 30 2026 | By Newsdesk