Useful Chatbots, Less-Is-More Tables and Data Mapping Billions of Birds
Our NodeXL #ddj mapping from Sept 17 to 23 finds numerous data to map, from @NatGeo‘s migration of billions of birds to @morgenpost‘s Berlin schools and @A24COM‘s internet access in Argentina. There’s also @dhanalytics‘ tips on improving data tables and @mcrosasb on two useful chatbots.
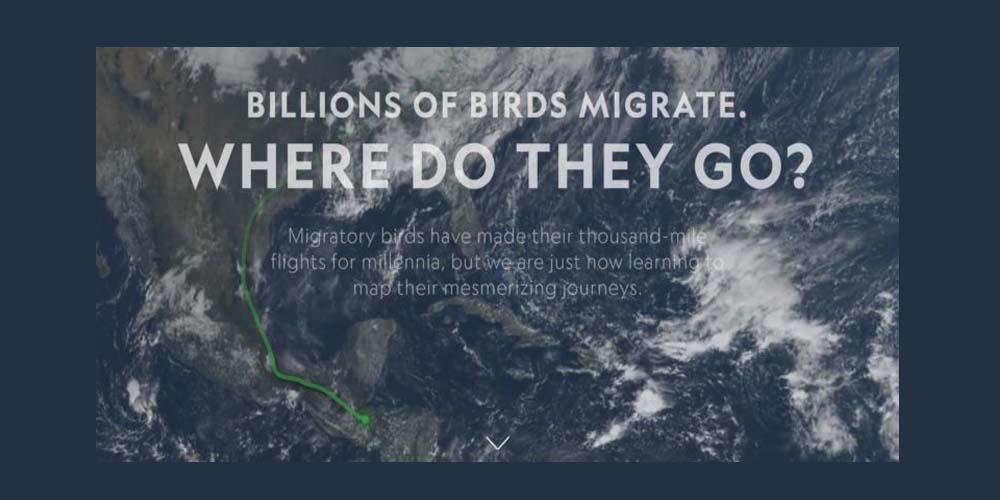
Mapping Billions of Birds
National Geographic’s senior graphics editor Brian Jacobs describes in detail the process behind creating an impressive data-driven feature on the journey of migratory birds. He writes about the challenges and solutions in dealing with the cartography, geographic processing, composition and effects, labelling, animations, data acquisition and more.
Credit by - GIJN
If you like the story and if you wish more such stories, support our effort Make a donation.
Trending News

Sat May 30 2026 | By Newsdesk

Sat May 30 2026 | By Newsdesk

Sat May 30 2026 | By Newsdesk

Sat May 30 2026 | By Newsdesk

Sat May 30 2026 | By Newsdesk